Testing Policy Contributions to a Policy Package
The CreateContributionTextScript.py python script is designed to perform simulations and record the data necessary to determine the contribution of any specific policy or user-defined group of policies to the results for any output variable. The resulting data can be used to construct wedge diagrams (where each policy's contribution to a package's total CO2e abatement is shown as a colored wedge) and policy cost curves (where each policy is depicted as one or more stacked boxes, whose width equals achieved CO2e abatement and height above or below the X-axis equals the cost or savings per ton CO2e abated). CO2e wedge diagrams and cost curves are available in the EPS's web interface, so you typically would only need to use this script if (1) you wish to create these graphs for a different variable, such as creating breaking out how policies within a package contribute to reductions in coal use, increases in electric vehicle deployment, etc., or (2) you have modified the input data or made other changes relative to the version in the web interface.
Before you begin to work with this script, ensure that your OuputVarsToExport.lst file is properly configured, as described in Selecting Output Variables for Any Python Script. By default, this file contains the variables needed to create a total CO2e abatement cost curve, which are:
Output Cumulative Total CO2e EmissionsOutput First Year NPV of CapEx and OpEx through This Year
Open the CreateContributionTestScript.py file in a text editor such as Visual Studio Code.
Filenames
Near the top of the script, the "File Names" section sets the filenames of various input or output files that will be used or created by the script, as well as the first year and the final year of the simulation. This section is shown in the screenshot below:
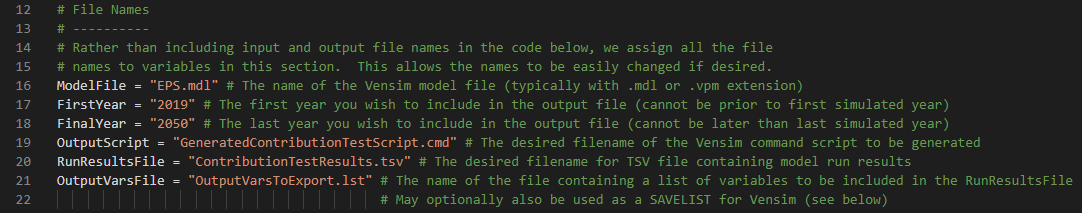
If you plan on only using this script to perform one series of runs (a "run set"), you can leave these lines alone. However, if you plan on doing more than one run set, you might wish to change the run results filename on line 19 for each version of the script, to avoid the possibility of the results from one set of runs overwriting the results from another run set. To do this, change "RunResults.tsv" (in the double quotes, colored orange in the screenshot above) to some other filename ending in .tsv, such as "ContributionsToFirstPackage.tsv" (in one copy of the script), "ContributionsToSecondPackage.tsv" (in another copy of the script), etc.
Run Name
Below the "File Names" section of the script is the "Other Settings" section, as shown in the following screenshot:
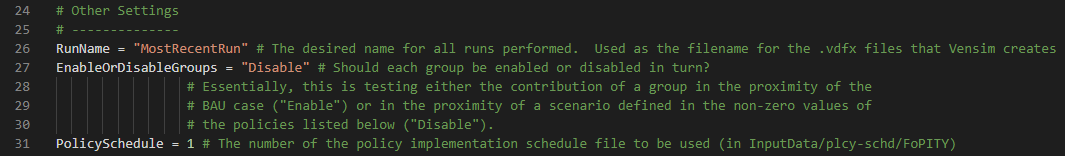
The first setting is for the run name. This is used as the name for the .vdfx (data) file that Vensim generates after each run. This is not important because that .vdfx file is over-written with every run that is part of a run set, so only the data from the final run of the run set will remain in that .vdfx file after the script execution is complete.
Enable or Disable Groups
The second setting is EnableOrDisableGroups. This setting defines whether you would like to test each policy (or policy group) in your policy package individually (e.g. determining the contribution of that piece of your policy package relative to BAU), or whether you would like to test what happens when each policy (or policy group) that is part of your package is disabled, leaving the rest of your package turned on (e.g. determining the contribution of that piece of your policy package relative to the scenario defined by the complete policy package). The "Enable" setting tests against BAU (by enabling policies or groups one at a time), and the "Disable" setting tests against the package (by disabling policies or groups one at a time).
Both settings can be useful for different purposes, and the best way to choose between them may be to make a judgment about the political environment or policymaker at whom the results are directed. If you have a preferred policy package that may consist of many policies, but you expect a policymaker to only be able to enact one or two policies (due to lack of political capital or other constraints), then it may be best to use the "Enable" setting. This way, you will determine which parts of your package would perform best when used in isolation. However, if you expect the policymaker to be able to enact the majority of the policies in your package, then testing with the "Disable" setting makes sense, since this will identify the policies that are most effective in the context of all of the other policies having successfully been enacted.
The EPS web interface uses the "Disable" setting (i.e. it disables each policy or policy group in turn) when building wedge diagrams and cost curves, because this mode captures interactive effects between policies within a package, and it is more common to wish to break apart and understand a complete package rather than to amalgamate the results of many policy options enacted individually.
PolicySchedule
In the "PolicySchedule" setting, specify the number of the policy implementation schedule to be used for this run set. For more details on policy implementation schedules, see Adjusting Policy Implementation Schedules.
Policy Options
Finally, in the "Policy Options" section, you are able to enable particular policies and adjust their settings. For example, the following screenshot shows three of the transportation sector policies, which appear on lines 148-150:

Each policy has a list of properties:
- whether the policy is enabled ("True") or disabled ("False")
- the policy's variable name in Vensim (with subscript settings if applicable)
- the policy's name as used in the Python script itself, which is derived from the display name for this policy in WebAppData and the display names of any subscripts it may have
- a list of policy settings in square brackets
- a policy group name, which indicates which policies should be enabled or disabled together (i.e. as a group), such that they form a single wedge on a wedge diagram or a single box on a cost curve
The only values you should edit are the enabled setting (changing "False" to "True"), the policy setting values (changing the non-zero value in the square brackets), and the group name. All policies that are included in your package should be enabled, and the non-zero setting should match the value that policy has in your package.
If you wish to test multiple policies together (that is, enabling and disabling them together, as if they were one policy), then they must have the same group name. This is very commonly desired for subscripted elements of the same policy. For example, in the screenshot above, the Transportation Demand Management (TDM) policy has two rows: one applying to passenger travel and one applying to freight transport. However, they have the same group name, Transportation Demand Management, so they will be enabled or disabled together, and there will be a single wedge or box for the TDM policy, not two.
Running the Script in Vensim
Finally, save and run the Python script to generate a Vensim command script, then run the Vensim command script using Vensim DSS to perform the runs. The procedure is the same as for the Data Logging script, described here. There will only be a single tab-separated value results file, ContributionTestResults.tsv. It will have one line per run for each variable (or each included element of a subscripted variable) in the OutputVarsToExport.lst file. It will specify which group is enabled or disabled for each run and will list the policies contained within that group.
Producing a Wedge Diagram
You may now generate a wedge diagram or cost curve using the output data. Wedge diagrams can be made in Microsoft Excel or a similar spreadsheet program using the following procedure:
-
Find the total contribution of the policy package (with all policies enabled) to the metric of interest, such as abated CO2e emissions. You do this by comparing the emissions in the run with all policies enabled to the emissions in the run with no policies enabled.
-
Add up the contributions of each policy to the metric of interest. Since the Energy Policy Simulator (EPS) accounts for policy interactions, the sum of the effects of the individually-enabled or individually-disabled policies (or policy groups) is unlikely to equal the total effect of the package.
-
Disregard any policies that make a counterproductive contribution to the metric of interest (such as a policy that increases CO2e emissions when you are graphing policies' contribution to CO2e abatement). Multiply each of the remaining policies by the ratio of the contribution of the complete policy package to the sum of the contribution of each policy or policy group when tested individually. For example, in 2050, if Policy A abates 3 tons (75%) and Policy B abates 1 ton (25%), and the two policies together abate 6 tons, then the wedge for Policy A in 2050 will have a thickness of 4.5 tons and Policy B will have a thickness of 1.5 tons. (Essentially, you are scaling the contribution of each policy such that, all policies taken together, add up to the total effects of those policies when simulated together as a policy package. Any policies that make a counterproductive contribution have the effect of lowering the whole package's performance, which makes all of the graphed policies' wedges smaller, rather than showing up as their own wedges.)
-
Create a stacked area chart, with each policy's contribution to the metric of interest as a single data series (a single colored area). If you are graphing abatement, you will need a data series for the remaining emissions, which you can set to transparent fill color in Excel, such that the policy wedges are graphed on top of the transparent remaining emissions wedge.
Producing a Cost Curve
Cost curves can be generated in Excel using the Cost Curve Generator.xlsx Excel file that is included in the EPS distribution. Follow the instructions on the "About" tab of that Excel file. No Excel plug-ins are required.