Adjusting Policy Implementation Schedules
The model allows the user to define a "schedule" according to which a policy will be implemented. This feature allows users to phase in policies in any years they prefer, and according to any shape curve (linear, sigmoidal, etc.). Additionally, it allows users to model policies that expire- for instance, by enabling a policy for a number of years, then disabling it at a later year during the model run. In older EPS releases, policy implementation schedules can be edited using a spreadsheet program such as Microsoft Excel or Open Office. As of EPS version 3.3.1, policy schedules are now managed by a single Python script rather than several large Excel files. This allows policies to be added and changed more easily, policy schedules generated more quickly, and there is no longer any risk of policy properties not aligning across different Excel files.
Because some users may be interested in editing policy implementation schedules in versions of the EPS older than 3.3.1, we provide guidance for both the Python and Excel versions of the files.
Policy Implementation Schedules in Python (versions 3.3.1 and later)
Python 3
Python 3 is a free and open source programming language. You can download and install Python 3 on your system from the official Python website. It is available for many operating systems, including Windows and Mac.
More information about editing and running Python scripts can be found on the Automated Analysis with Python Scripts help page].
Editing Policy Implementation Schedules in Python
Within the InputData folder of the downloadable model package (described on the Included Input Data help page), navigate to the "plcy-schd" folder, then the "FoPITY" folder. The contents of the folder should look like this:
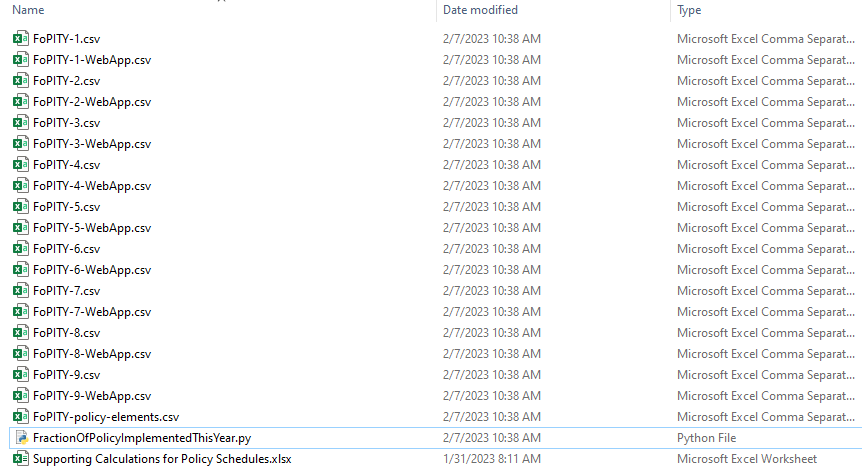
Opening the FractionOfPolicyImplementedThisYear.py file in a text editor will bring up the FoPITY Python script, which includes detailed instructions for running. When run, the file generates .csv policy schedule files for all designated scenarios. Users can specify up to nine different implementation schedules by default, with two .csv files generated for each - one to be read by Vensim, and the other to be read by the web app (the web app versions of the file will only be used if you are creating a scenario to be displayed online in an official model release).
The file lists a policy element for every possible policy in the model, including an element for every possible subscript combination. For example, the Fuel Economy Standards policy is subscripted by both cargo type and vehicle type. The screenshot below shows part of this list:
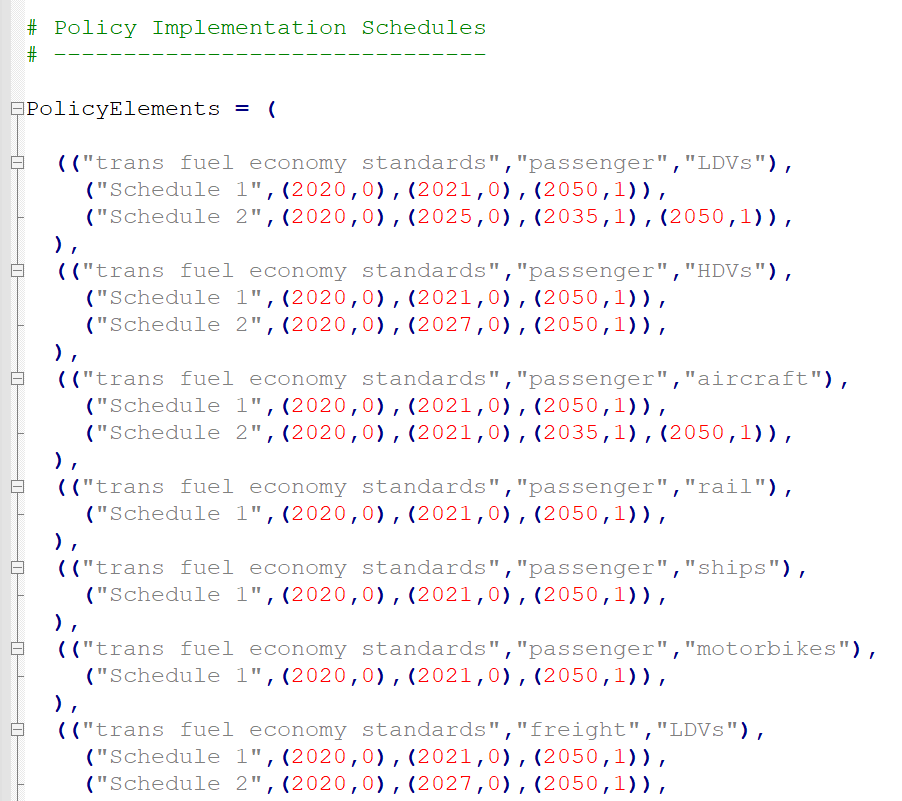
At least one schedule must be defined for every policy element. Each schedule has a schedule number ahead of its data indicating which schedule file should use those data. All the policy elements do not need to have the same number of schedules defined. If you leave a particular schedule for a particular element undefined, the script will use that policy element's first listed schedule. For example, in the screenshot above, "Schedule 2" uses custom values for passenger LDVs, passenger HDVs, passenger aircraft, and freight LDVs. Because there are no custom values specified for passenger rail, passenger ships, or passenger motorbikes, those policy elements default to the values set in "Schedule 1."
In the U.S., the FoPITY Python script includes the default settings in "Schedule 1" and one additional schedule for the two example policy displayed in the web app ("Schedule 2" corresponds to the NDC Scenario). Therefore, users who want to create a new custom schedule would likely want to start by creating a "Schedule 3" on top of the other schedules already listed in the FractionOfPolicyImplementedThisYear.py file.
Default Schedules for Linear and for Immediate Policies
Each policy has values that range from zero to one. A value of zero means that the policy is not enabled in that year. A value of one means that the policy is implemented at the strength set by the user via the policy levers in the model. In the default schedule, nearly all policies are off in the first simulated year (we typically want to model policy in future years, and the first simulated year is a historical year). Most policies by default begin phasing in linearly in the first non-historical year and reach full strength in the last modeled year. Other policies that control default behavior remain at full strength throughout the model run.
Default Schedules for R&D Policies
Instead of linear implementation, by default, the R&D policies are implemented along a segment of a sigmoidal (S-shaped) curve. The "Supporting Calculations for Policy Schedules.xlsx" file contained in the FoPITY folder includes the relevant assumptions and displays a graph of the implementation schedule, as shown below:
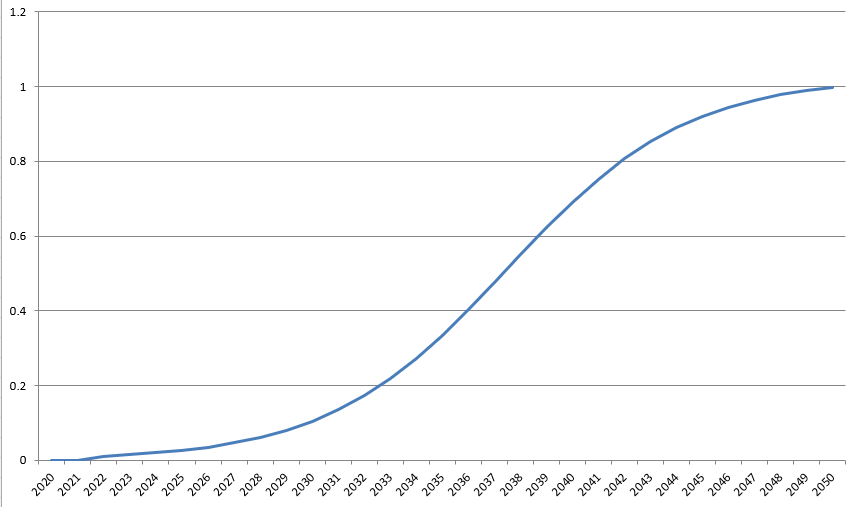
The default R&D policy schedule reflects the idea that additional investment in R&D achieves progress slowly at first, as staff and laboratories gear up, acquiring skills and knowledge. Progress is faster in middle years, then slows down again as the easier technical questions are answered, leaving the more challenging technical problems to be solved. The future progress of technological research cannot be known in advance, and the curve specified here is meant to be a reasonable example. When specifying your own curve, it is not necessary that the entire S-shape be visible within the model run period. Since we are concerned with an additional R&D commitment, generally the curve should start relatively flat (as even a technology that is well along its own S-curve will nonetheless respond gradually to a change in its level of R&D investment). However, there is less reason to believe that the inflection point for additional R&D commitment will necessarily be reached during the model run period: a curve that starts relatively flat and grows at an increasing rate through 2050 could be plausible for some technologies.
Notes for Setting Values
In the default policy implementation schedule, policies are never weaker in a later year than they were in an earlier year: either they remain at full strength (a value of "1") throughout, or they linearly approach full strength. However, there is nothing to stop a user from specifying a policy implementation schedule that reaches "1" and then declines. For example, one could explore a scenario where a subsidy for electricity generated by solar PV starts high and declines over time, as the technology matures and less policy support is needed. One could also explore a scenario where a policy becomes strong, then expires, abruptly returning to a value of zero.
When you specify a policy implementation schedule, you should ensure that it reaches a value of "1" in at least one year. This is because "1" means the user's policy setting is fully implemented. If you want the policy to be weaker, you should simply set a less-strong setting for the policy itself, rather than using an implementation schedule that never fully implements the policy. To create a schedule that does not include a "1" value in any year can cause confusion, as a user wonders why the setting that he/she specified in the model using the policy levers is not reached in any year of the model run.
Similarly, you should never specify a value greater than "1" in the policy implementation schedule, because this violates the assumption that "1" means full implementation of the user's setting. If you want the policy to be stronger, you should increase the strength of the policy setting, not implement more than 100% of the policy.
Lastly, you should never specify a negative number in the implementation schedule, because this will cause the policy to have the opposite of its intended effect and/or will cause the model to function improperly.
Selecting Implementation Schedules in Vensim
Once you have set your desired implementation schedules and run the FractionOfPolicyImplementedThisYear.py file to generate new .csv files, you will need to tell Vensim which schedule to use. On the Policy Control Center sheet within Vensim, the policy implementation schedule is set with the Implementation Schedule Selector, shown below:

You can use the slider bar to select the number corresponding to the schedule number you'd like to use in a given scenario. When you save your scenario (see Creating and Managing Scenarios), the correct schedule number will be saved.
Policy Implementation Schedules in Excel (pre- 3.3.1)
The Implementation Schedule File
In EPS versions earlier than 3.3.1, the contents of the "FoPITY" folder within InputData will look slightly different. The folder will contain at least one version of a file with a title like "Fraction of Policy Implemented This Year - 1 - Default.xlsx." This file refers to the default implementation schedule, but there may be additional files with a .xlsx extension with similar names for example scenarios provided for the modeled region. The files will each contain a few tabs, labeled "About," "Set Schedules Here," and blue output tabs labeled something like "FoPITY-1" and "FoPITY-1-WebApp." The "About" tab provides guidance on how to use the file to specify policy implementation schedules. Users can set their implementation schedule values in the "Set Schedules Here" tab. For each policy element, the file will contain a gray row with year values and a white row to set the corresponding settings for the given year, as shown below:
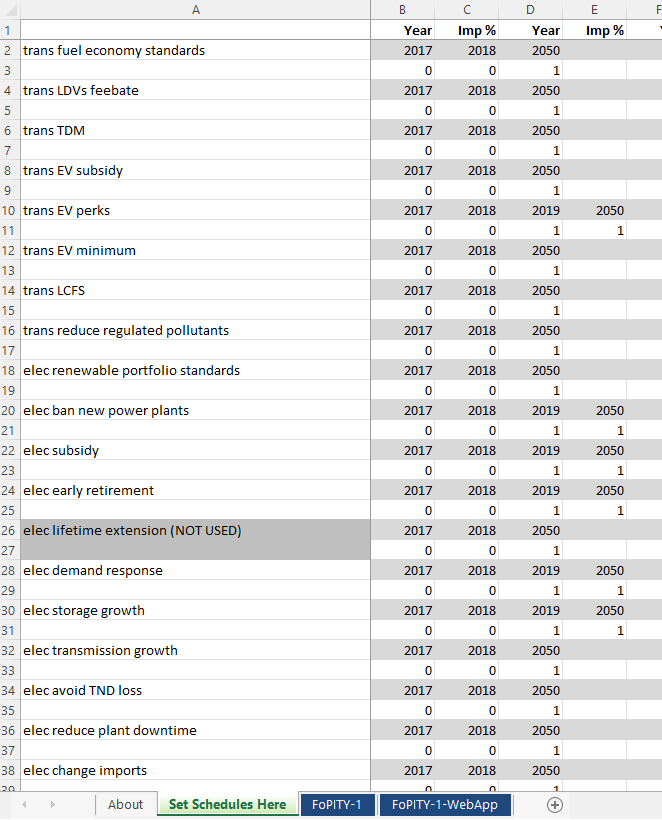
The spreadsheet will automatically update the values in the blue output tabs in response to the values in the "Set Schedules Here" tab. Then, the user should export the blue tabs as .csv files, overwriting the corresponding .csv files already in the FoPITY folder. To create a new schedule number 4 for example, users can copy a preexisting .xlsx file, customize it for their desired settings, and save the blue output tabs as FoPITY-4 and FoPITY-4-WebApp.
The same notes on on default settings, setting values, and selecting implementation schedules in Vensim above still apply in EPS versions earlier than 3.3.1.
This page was last updated in version 4.0.4.