How to Prioritize Policies for Emissions Reduction
Policymakers have many types of policy at their disposal to limit global warming to the two-degree Celsius target: performance standards, economic signals, research and development support, and supporting policies – but no one policy silver bullet can solve climate change.
New advances in modeling show that a small set of policies, designed and implemented well, can cost-effectively deliver deep carbon reductions. Strong climate and energy policies work best when they work together to reinforce each other and drive down costs of emissions abatement.
One size does not fit all for designing climate solutions, and each country must determine which interlocking policies most cost-effectively reduce emissions within its own borders. While performance standards, economic signals, R&D policies, and supporting policies are all be part of a strong policy portfolio, a country’s emissions should be quantitatively assessed so governments can identify abatement potential, costs, and other decarbonization policy effects.
Policies with large potential abatement and long lead times that deliver economic savings should be prioritized first. Initial policy action must be followed with sector-specific performance standards, carbon pricing, and R&D-supporting policies to help lower abatement costs and provide additional compliance options. Other considerations like political feasibility must also be considered.
Take a Quantitative Look at the Economy
Critical Action: Assess the Structure of the Economy and Sources of Emissions
Ultimately, reducing emissions comes down to decarbonizing the large energy-consuming products and processes in the physical economy: cars, buses, and other vehicles; buildings and appliances; power plants; and factories.
Therefore, a process to identify and prioritize the policies that will make the biggest difference for reducing emissions in a particular country must start with an evaluation of those energy-consuming products and processes in that country. How many cars are there? How efficient are they? How do we expect the number of cars and their efficiency to change over time? And so on.
This critical first step will highlight the main sources of emissions in the particular country and the trajectory of future emissions, which can help highlight priority areas of focus. For example, one analysis of Indonesia’s energy sector predicts a nearly tenfold increase in electricity demand by 2050, meaning that electricity sector policies designed to prevent coal generation from filling all or most of this demand would probably reduce emissions significantly by 2050.
Recommended Action: Evaluate Emissions Impacts of Different Options
Energy and technology assessments need not be overly complex. A high-level understanding of the sources of energy demand and emissions can serve as a starting point for prioritizing policies. That being said, with more information, policymakers can make better policy decisions, better estimate the impacts of policies on future energy use and emissions, and thereby understand whether they are on track to achieve climate goals.
Using information from energy and technology assessments, policymakers can next move to quantitative evaluations of technology and policy abatement potential. This is an important step for robust assessment and prioritization, but in resource-constrained regions, it should be possible to sort out priorities based on the overall assessment of the economy and emission sources outlined earlier.
Tools for Evaluating Emissions Impacts: The Marginal Abatement Cost Curve
A common method for evaluating greenhouse gas emission abatement potential is a technology assessment. Technology assessments evaluate the potential for specific improvements in equipment to produce greenhouse gas reductions. For example, a study of the power sector in a particular country might show that replacing coal power plants with hydropower, solar, and wind plants can reduce emissions by 200 million metric tons (MMT) of CO2e. Technology assessments are helpful for identifying the potential greenhouse gas reductions from specific changes to equipment such as vehicles, power plants, or motors in factories.
In many instances, assessments of technology potential are paired with estimated changes in capital, operating, maintenance, and fuel costs. The cost estimates can then be used to determine the relative cost-effectiveness of different technological options. For instance, the same example study on the power sector might find that replacing the coal plants with hydropower, solar, and wind plants raises capital costs by $100 million but lowers operating costs over the lifetime of the power plants (from savings on coal as a fuel) by $200 million, for a total of $100 million in savings. In aggregate, switching to these plants would save $1 for every ton of CO2e reduced.
Similar assessments can be done for a large range of technology options and compared with each other on a marginal abatement cost curve, where the potential abatement guides the size of any option on the x-axis, and the cost-effectiveness of any option determines the size of any option on the y-axis.
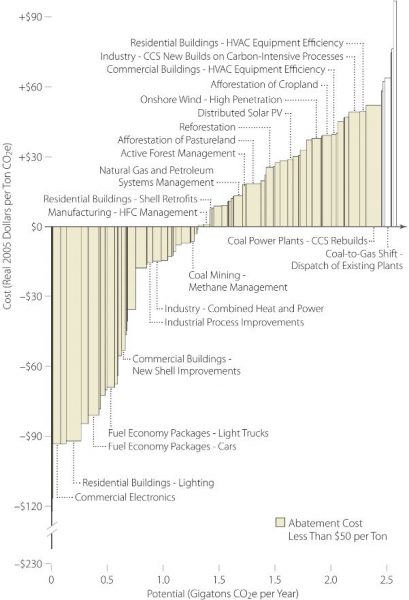
U.S Mid-Range Abatement Curve-2030. Source: McKinsey & Company.
Policymakers can use marginal abatement cost curves to evaluate the abatement potential and cost-effectiveness (in dollars per ton of greenhouse gas reduced) of specific technological improvements over a certain timeframe. The McKinsey cost curves are an example of this type of analysis. Marginal abatement cost curves are a highly useful tool for providing policymakers with insight into which technologies can most reduce emissions and the relative costs of different technology options.
For example, McKinsey finds that globally, improving the efficiency in motor systems in the chemical industry could abate about 250 MMT of CO2e in 2030 and generate savings of roughly €60 per ton of CO2e avoided.
Although marginal abatement cost curves are a useful tool for policymakers, they lack critical detail on how policymakers can achieve the technology improvements they specify. In other words, they are technology oriented; as is common in climate and energy modeling, these curves offer a technology-by-technology look at abatement potential and cost.
Although it is valuable to understand the technological potential for emission reductions from different technologies, this does not answer the critical “what to do on Monday morning” question facing policymakers: Which policies can they use to most cost-effectively cause these emission-reducing technologies to be deployed?
Tools for Evaluating Emissions Impacts: The Policy Cost Curve
The best option for policymakers to use to sort out what specific actions they should prioritize is to focus on policies, rather than technologies, using a policy cost curve. Few tools exist that take this perspective. The Energy Policy Simulator (EPS), a free, open-source, highly vetted computer model developed by Energy Innovation is one such tool. The EPS is a significant advance in the field of abatement cost curves because it allows policymakers to evaluate the abatement potential and cost-effectiveness of policies rather than technologies.
The EPS is a system dynamics computer model that estimates the effects of various policies on emissions, financial metrics, electricity system structure, and other outputs. The EPS model is designed to represent different countries by incorporating input data specific to the country in question, and more detail on the technical workings of the EPS is available in the EPS online documentation
Policy cost curves require the same types of input needed to generate marginal abatement cost curves, but they include a consideration of the ability of policy to realize these technological changes on the ground. For example, in the power sector example earlier, the marginal abatement cost curve doesn’t specify which policies would be most cost-effective to cause the hydropower, wind, and solar plants to displace coal, just that doing so could abate 200 MMT.
By contrast, a policy cost curve would use a specific policy (or a set of policies), such as a renewable portfolio standard (RPS) of 50%, to achieve the same emission goal in the power sector. The EPS might even find that a 50% RPS would cause a different set of renewable technologies to be built, to achieve the same emission reduction at a lower cost. The advantage of this approach is that it helps inform policymakers about the specific policy instruments they can use and what stringency is necessary for each policy to achieve the targeted emission reductions.
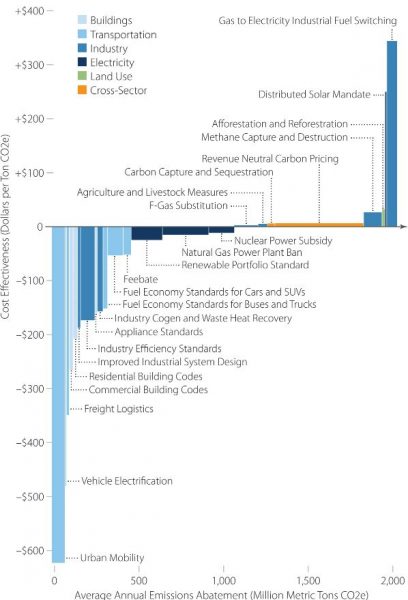
The policy cost curve shows the cost-effectiveness and emissions reduction potential of different policies.
Much like marginal abatement cost curves, policy cost curves also compare the cost-effectiveness and abatement potential of policies with one another, providing insight into which sets of policies can deliver the largest and cheapest emission reductions. This policy abatement cost curve for the U.S. generated using the EPS shows a cost curve for various policies, each set to a high level of stringency.
Each box represents a particular policy at a particular setting— with width indicating average CO2e emission abatement per year and height representing average costs or savings per ton of CO2e abated through 2050. Boxes below the x-axis represent policies calculated to save money on average through 2050, and boxes above the x-axis cost money.
At the far left of the curve are the cost-saving policies, which are dominated by performance standards. Performance standards often result in cost savings because in many instances the savings opportunity already exists, but other market barriers prevent action to realize those savings, like the split-incentive barrier in the building sector. Carbon pricing is unlikely to capture these efficiency options, given that they are cost saving even without additional policy yet are still available. In these instances, a performance standard will unlock savings, where an economic signal may not be enough to overcome market barriers.
The reduction potential and costs of economic signals are clustered at the middle of the policy abatement cost curve. Economic signals, such as carbon pricing, can capture low- and medium-cost emission savings and are particularly important and effective for industries that are highly motivated by costs with low market barriers and readily available substitutes. For example, a carbon price can reduce emissions in the power sector if electricity is dispatched based on the least-cost set of resources and the electricity mix is highly diversified, allowing lower-emitting options to displace higher-emitting ones.
Though not shown on this cost curve, R&D policies can be thought of as an overlay that decreases the costs or increases the savings of the policies included in the curve. R&D policies are intentionally excluded from policy abatement cost curves because the impact of a dollar spent on R&D on emissions is extremely uncertain. Nevertheless, R&D is critical to unlocking new technologies and to driving down the costs of existing low-carbon technologies. R&D helps to reduce the costs and increase the savings from performance standards and economic signals.
Developing marginal abatement cost curves or policy cost curves can be time consuming and expensive, and in many instances the findings may be similar to those of other countries. As a result, resource-constrained policymakers should consider looking at similar countries that have conducted quantitative policy analyses for insight. In many cases, the same set of top-level findings are consistent across countries.
Marginal abatement cost curves and policy cost curves provide policymakers with insight into their available options and the abatement potential and costs of those options. But policymakers still have to prioritize the strongest and most cost-effective policies once they have this information.
Prioritize Policies
Hundreds of energy and climate policies may exist on the policy cost curve, each of which has different strengths and weaknesses and targets different outcomes. To prioritize the options, it is useful to create a hierarchy of selection criteria.
Here it is important to reiterate the need for a portfolio of policies to drive greenhouse gas emission reductions rather than any single policy. Savings from one policy can be used to pay for costs of another. Performance standards, economic signals, and R&D policies have a virtuous interactive effect. The most effective approach will be one that leverages the benefits of different policies and policy types to reinforce others.
Policy selection criteria—in order of priority—include emission abatement potential, cost, and other considerations, outlined here.
Greenhouse Gas Abatement Potential
Above all else, policies should be prioritized based on their potential to reduce greenhouse gas emissions, because this is the primary goal of climate policy. If specific policies have dramatically higher potential abatement, policymakers should focus on these first. This will maximize emission reductions while limiting the number of policies needed to hit any emission target.
Policymakers should evaluate abatement potential in aggregate over a set number of years for two reasons. First, in terms of global warming, what ultimately matters is the cumulative amount of greenhouse gases—and their associated warming impact—in the atmosphere, not the emissions in any particular year. Second, depending on the type of policy, the emission reductions in any single year might vary widely. For example, energy efficiency standards drive growing reductions over time as existing equipment is retired and replaced by new, more efficient equipment. Looking at a snapshot in any single year is therefore likely to misrepresent the savings potential of those policies. Therefore, it is best to think in cumulative totals over time.
Notably, many of the low-cost or cost-saving reductions that can be achieved with performance standards require a long time horizon to fully take effect. More specifically and as noted earlier, performance standards often influence only new equipment, and their impact grows as the existing fleet—whether it’s vehicles, air conditioners, or industrial motors—wears out, retires, and is replaced by new equipment. Because emission reductions are needed as soon as possible and performance standards take time to reach their full effectiveness but often deliver cost savings, there is a strong case for implementing performance standards as soon as possible.
Economic Impacts
After greenhouse gas abatement potential, the economic impact of a particular policy is the most important criterion to consider. For example, among two equally effective policies, one may have lower costs (or may drive more savings) than the other. When evaluating policies, two types of economic impacts are important to consider: direct economic and macroeconomic.
Positive or Small Negative Direct Economic Impacts
Typically, emission reductions involve some upfront capital investment that returns a stream of benefits, often involving lower energy costs (in the case of energy efficiency), lower operating costs (in the case of renewable electricity sources such as solar and wind, in which case the “fuel” is free), or increased revenue (in the case of methane capture, where additional product is available). When evaluating a policy for its economic impacts, it is necessary to consider both the upfront capital cost and the benefits that accrue over time. In many instances, energy and operating cost savings will more than pay for the upfront capital cost, even after inflation and discounting are considered.
The best way to evaluate impacts is to look at the net present value of a policy, which accounts for the upfront capital cost and the stream of costs or savings that results as well as the cumulative emission abatement. A net present value provides a good approximation of the direct economic impact on individuals, businesses, and governments of complying with a given policy. Priority should be given to the policies with the lowest costs or largest savings.
Positive Macroeconomic Effects
Because climate policy affects energy choices, and energy is used in every sector of the economy, climate policies have ripple effects throughout the economy. Macroeconomic models are used to evaluate these and to provide insights into effects on jobs, wages, and overall gross domestic product (GDP), which are all important political considerations. Generally, macroeconomic modeling amplifies the direct effects of energy policies.
However, some important structural shifts have been observed in response to certain climate and energy policies. Generally, the energy sector is capital intensive and produces few jobs compared with the local goods and services that make up most household spending. Therefore, even cost-neutral energy efficiency projects have positive job creation effects.
Other analysis has found that renewable electricity generation produces more jobs than fossil-fueled electricity generation. Over the longer run, climate policy produces energy innovation, which helps make companies in the country affected by these policies better able to compete in global markets. For example, China’s renewable energy push has it made a global exporter of renewable technologies and helped grow its economy.
Of course, if climate policy raises the prices of direct inputs for companies participating in global markets, it may be worthwhile to rebate some savings from the climate policies back to those companies, so that they can remain globally competitive. This question—how are climate policies affecting a country’s companies—should be assessed and tackled on a case-by-case basis for each industry in each country.
Although macroeconomic effects may be difficult to estimate, they are worth considering when evaluating which policies to implement.
Other Considerations
Political Feasibility
It goes without saying that a key consideration of any climate policy is whether it stands a chance of being enacted. A highly abating and perfectly designed policy is not worth pursuing if there is no chance it can be implemented. To that end, policymakers should consider whether the specific policies they want to focus on have a reasonable chance not just of being passed but of being implemented, and focus on those with higher likelihood of being implemented well to drive change on the ground.
Energy Security
Many countries import a portion of their fuels from elsewhere. Being dependent on foreign sources of energy makes a country more vulnerable to supply disruptions, price shocks due to geopolitical events, and political pressure applied by trading partners. It may also skew a country’s decisions about which other nations to support, or not to support, through foreign aid or military power. All told, it can reduce a country’s autonomy and constrain a country’s choices.
Policies that reduce the use of fuel types that are largely or partially imported help reduce these negative effects and increase the extent to which a country may pursue its own interests. Although policies that increase domestic energy production (whether clean energy or fossil energy) have the same effect, reducing dependence on fossil fuels is a better strategy, because increasing production of fossil sources would undermine emission reduction goals.
Public Health and Other Co-Benefits
Most policies that aim to reduce greenhouse gas emissions have co-benefits: positive effects for society other than mitigating climate change. The most important co-benefit is usually an improvement in public health (“Improved public health” means fewer people get sick and fewer people die prematurely). Thermal fuels, including all fossil fuels and biomass, release harmful air pollutants when burned, such as particulate matter, nitrogen oxides, sulfur oxides, and volatile organic compounds. The effects of these pollutants on human health can be estimated with epidemiological concentration–response functions and demographic data. Policymakers should take into account the number of human lives or, better, the number of quality-adjusted life years that will be saved by implementing emission reduction policies.
Certain emission reduction policies have other co-benefits. For example, urban mobility policies that reduce the number of cars on the roads (by encouraging mode shifts to biking, walking, and public transit) reduce lost time and productivity due to sitting in traffic. These policies also help counter the sedentary lifestyles that are main contributors to the most damaging diseases in advanced economies. Policymakers should think about the full spectrum of benefits offered by each policy when assembling a package of policies to drive down emissions.
Social Equity
The main purpose of greenhouse gas emission reduction policies is to avert tremendous harms from climate change that otherwise would damage human society. Low-income people around the world are particularly affected, because they do not have the resources to easily adapt to climate shifts. These impacts on vulnerable people dwarf any regressive economic effects of the emission abatement policies themselves.
Accordingly, even an emission abatement policy that has a regressive economic effect is, on the whole, probably beneficial to lower-income people and justified. Nonetheless, it is ideal to structure emission reduction policies to minimize the burden they impose on low-income residents, so costs can be borne more equitably by society.
Some policies, including many performance standards, do not impose net costs over the life of the assets they target: Fuel savings more than make up for the initial difference in capital cost between a more efficient and a less-efficient model. In these cases, it may be helpful to soften the initial capital outlays via a rebate program, zero-interest financing, or similar mechanism.
Other policies, such as carbon pricing, do impose net monetary costs. Even if the cost is imposed upstream, for example at a petroleum refinery or power plant, a large portion of the cost will be passed on to consumers. Low-income consumers spend a greater fraction of their income on energy services, such as transportation, heating, cooling, lighting, and cooking. Therefore, just like sales taxes and value-added taxes, carbon pricing tends to place a greater burden on lower-income people.
The very purpose of carbon pricing is to make the financial cost of fossil fuel use better reflect its true costs to society. Therefore, it is appropriate that all people, of all income levels, should pay for the full value of these harms. Instead of providing exceptions to carbon pricing or choosing a pricing that is too low to reflect the true costs of fossil fuel combustion, policymakers can use the revenues in a way that helps offset the negative impacts of carbon pricing on low-income people.
Put Together a Smart Portfolio of Policies
Although there are dozens of policies for policymakers to choose from, decades of experience designing and implementing policies in countries, regions, and cities around the globe has revealed that a small handful of well-chosen and well-designed policies can deliver deep decarbonization.
A pattern emerges in policy modeling: Different regions typically yield similar findings. There is of course variation in relative effectiveness of different policies based on a country’s economic structure and emission sources, but the same small group of policies (implemented stringently and designed well) consistently emerge as being capable of delivering huge reductions in greenhouse gas emissions cost-effectively. So which policies are they?
Using the EPS and regional greenhouse gas emissions published by Pacific Northwest National Laboratory and the Joint Global Change Research Institute at the University of Maryland, we evaluated the global potential for climate and energy policies to lower emissions between now and 2050 and give the world at least a 50/50 chance of staying under two degrees by the end of the century.
Our analysis confirms that a small set of strong climate policies can put us on a promising emission trajectory across each of the major energy sectors.
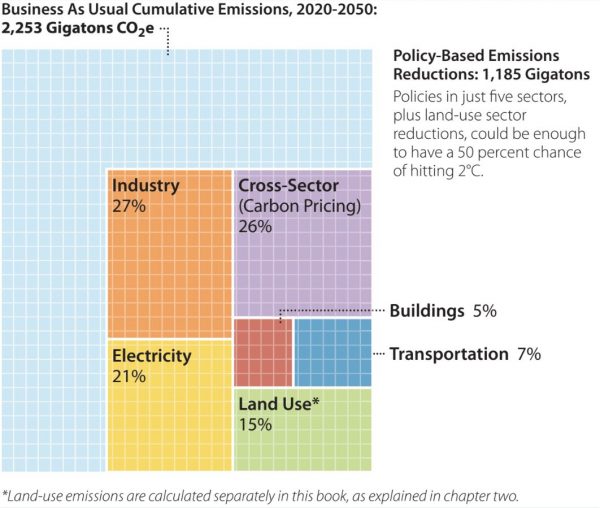
Sectoral contributions to meeting the 2°C global warming target.
Each top policy has relative contributions to meeting the global greenhouse gas emission abatement necessary to meet the two-degree target. These top policies include RPS and feed-in tariffs; complementary power sector policies, such as utility business model reform; vehicle performance standards; vehicle fuel fees and feebates; electric vehicle policies; urban mobility policies, such as parking restrictions and increased funding for alternative transit modes; building codes and appliance standards; industrial energy efficiency standards; industrial process emission policies; carbon pricing; and research and development policies.
It’s worth noting that the policy reduction potential in this analysis is incremental to existing policy. In other words, the potential of specific policies to deliver emission reductions does not account for the effect of policies already enacted. Rather, it looks at the potential for strengthening existing policies, in addition to adding new policies where they do not already exist.
For example, China, Europe, and the U.S. already have strong fuel economy standards in place through the 2020s. Although we estimate the impact of strengthening these standards, our analysis does not attribute future emission reductions from existing standards. Everything is incremental.
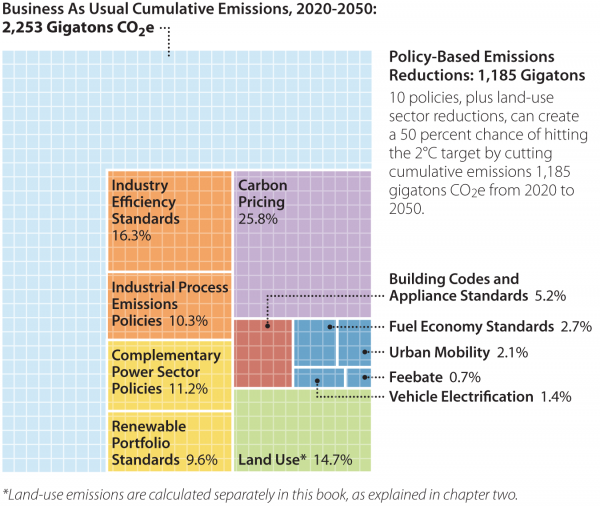
Policy contributions to meeting the 2°C global warming target.
Where designed and implemented well, each of these policies has a demonstrated track record of success, driving significant emission reductions. Consider, for example, the success of RPS in driving down power sector emissions in California, the huge efficiency improvements achieved by Japan’s Top Runner program for passenger vehicles, and the vast improvement in industrial energy use from China’s Top 10,000 Industries project.
Conclusion
Strong climate and energy policies reinforce one another and drive down the costs of emission abatement. Performance standards, economic signals, R&D policies, and supporting policies should all be part of a strong policy portfolio. Quantitative assessment of a country’s emission sources is a must, and further work can help identify the abatement potential, costs, and other impacts of policy options. Policymakers should then prioritize their efforts on policies with the highest potential abatement and lowest costs. Policies with large potential abatement and long lead times that deliver economic savings should be prioritized first.
Policymakers should round out a policy portfolio with additional sector-specific performance standards, strong economic signals (principally carbon pricing), and R&D and supporting policies that help lower the costs of abatement and provide additional compliance options. Other considerations, such as political feasibility, are important as well.
It is no longer a mystery which policies can most effectively reduce emissions. Decades of experience and new advances in modeling have revealed that a small set of policies, designed and implemented well, can deliver deep carbon reductions cost-effectively.