Methodology
This website and book estimate the potential of individual policies to meet a future emission and warming scenario. These estimates are not meant to represent the exact abatement potential achievable in each of the regions modeled. However, they are supposed to indicate the relative magnitude of different policy options and to demonstrate the value in having a broad suite of policies with strong early action and continuous improvement.
Reference Scenario Emissions
Ideally, forecasting emissions and potential reductions would rely on emission projections from each country through 2050. However, most countries do not have projections to 2050. Even when countries do have projections to 2050, they often omit certain sectors (e.g., land use or industrial processes) or use different global warming potential values. Given the paucity of 2050 emission projections and the heterogeneity of the projections that do exist, a country-level analysis was not possible.
Instead, we relied on regional emission modeling completed under the Low Climate Impact Scenarios and the Implications of Required Tight Emission Control Strategies (LIMITS) modeling, initiated by the European Union and published in 2013. LIMITS modeling has been used to assess previous climate negotiation scenarios relying on the same models used extensively in the Intergovernmental Panel on Climate Change (IPCC) Fifth Assessment Report (AR5). Of the major climate modeling exercises, it has the finest level of detail, with ten super-regions (whereas most other modeling efforts evaluate only five regions) and the most up-to-date forecasts at the time of this writing.
The LIMITS modeling exercise included several different model teams from around the world. Based on the availability of sector-specific results and alignment with other modeling, we chose to use the Pacific Northwest National Laboratory and the Joint Global Change Research Institute’s model results using the Global Change Assessment Model (GCAM).
For our reference scenario, we used the “Base” scenario, which assumes no near-term or global action on emissions through 2100. The Base scenario for the GCAM compares with the other models used for LIMITS and the Representative Concentration Pathway (RCP) 8.5 Scenario, the business-as-usual scenario in AR5.
Under the Base scenario, global greenhouse emissions grow from 48.0 Gt CO2e in 2010 to 84.7 Gt CO2e in 2050, using global warming potential values from the IPCC Fourth Assessment Report (AR4) and covering CO2, methane, nitrous oxide, and F-gases. We used values from AR4 because emission values for F-gases are available only in aggregate CO2e and therefore cannot be adjusted to values used in the AR5. The GCAM emission trajectory is roughly a mid-case scenario across the different models.
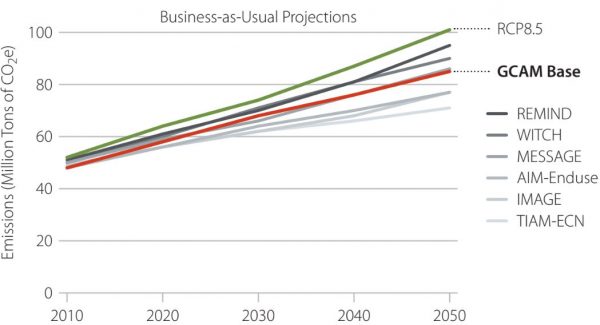
Business-as-usual emissions projections. Source: International Institute for Applied Systems Analysis.
2050 Target Emissions Level
The LIMITS study mapped two sets of climate policy targets: a 450-ppm scenario with radiative forcing of 2.8 W/m2, giving a greater than 70% chance of staying under two degrees of warming; and a 500-ppm scenario with radiative forcing of 3.2 W/m2, giving a 50% chance of staying under two degrees of warming.
The LIMITS modeling evaluated different scenarios for achieving those targets. These include a benchmark scenario, a Reference Policy scenario (“RefPol”), and a Strong Policy (“StrPol”) scenario, in addition to variations on each of these.
The RefPol scenario assumes a weak near-term target with fragmented action until 2020. The StrPol scenario assumes a stringent near-term target with fragmented action until 2020.
We used the RefPol-500 scenario, which combines the target and near-term action assumptions of the RefPol scenario with the emission target of the 500 scenario, in assessing necessary emission reductions through 2050. The RefPol-500 scenario is a good policy scenario because it assumes some limited action through 2020, reflective of the current state of affairs on global climate policy, with significant reductions after 2020 to achieve the 500-ppm target.
For context, the GCAM RefPol-500 scenario is one of the more aggressive emission reduction scenarios between 2020 and 2050. It falls roughly in between the RCP2.6 and RCP4.5 scenarios from AR5, and the GCAM RefPol-500 scenario compares with these other low-emission scenarios.
Using the RefPol-500 scenario as our policy target, we estimated necessary reductions by calculating the cumulative emission reductions between 2010 and 2050 between the Base scenario and the RefPol-500 scenario. Although the LIMITS modeling runs to 2100, we limited our assessment to 2050 in order to use the Energy Policy Simulator (EPS) for the analysis.
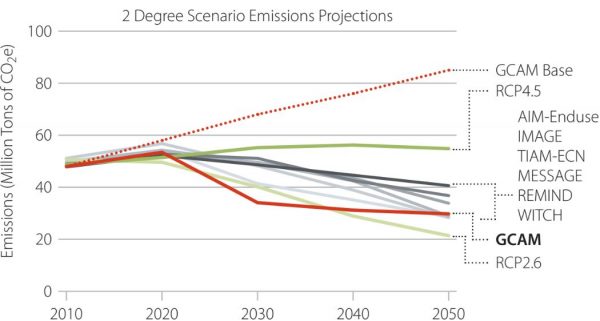
2°C scenario emissions projections. Source: International Institute for Applied Systems Analysis.
Next, we estimated real business-as-usual emissions between 2010 and 2020 using observed data on emissions between 2010 and 20143 and extrapolating this trend to 2020.
Accounting for the difference in observed/forecasted business-as-usual emissions between 2010 and 2020 and the GCAM emission projection over this period, we then calculated the total emission reductions needed between 2020 and 2050 from the LIMITS modeling. This value, a 43% reduction in cumulative emissions, served as our emission target.
Mapping Onto Reference Countries
The Energy Policy Simulator (EPS) served as the primarily tool for calculating the potential of policies to reduce emissions. To use the EPS, we first mapped each sector in each of the ten super-regions from the LIMITS modeling onto the sector of an existing EPS model. At the time of the analysis, we had models for the United States, China, Indonesia, Poland, and Mexico. We could not use the Mexico model because it evaluates emissions only to 2030, whereas the other models evaluate emissions to 2050.
Each of the sectors in the ten super-regions was mapped onto the same sector in either the U.S., China, Indonesia, or Poland model, based on how closely the rate of emission growth (or decline) in that sector matched the same sector in one of the four EPS models. In some instances, expert judgment was used to map a sector onto the most similar country model. We also mapped each region onto a country as a whole to assess cross-sector policies, such as carbon pricing.
Representative Country Abatement Potential
Policy scenarios were then developed for each of the reference country EPS models, using similar policy settings. In some instances unique policy settings were used that reflect the unique abatement options available to different country types. For example, a ban on new coal power plants was used in Indonesia, a region that has a large forecasted increase in electricity demand. However, this policy was not used in China, the U.S., or Poland, which all have flat electricity demand or are already oversupplied. After 2030, where applicable, policy settings increase at 1% per year through 2050. In some cases the policy settings may seem arbitrary, but they were set to achieve uniformity (e.g., fuel efficiency standards for light-duty vehicles were designed to achieve 70 miles per gallon in 2050 across all models).
Potential Reductions By Policy
We then calculated the percentage reduction in sectoral emissions in each of the EPS models for each policy. For example, we calculated the annual percentage reduction in emissions in the power sector from a renewable portfolio standard of 40% in the “U.S. EPS model” to avoid confusion. We did this assessment for every policy enabled. For cross-sector policies, such as a carbon tax, we looked at the reduction in economy-wide emissions after accounting for reductions from the sector-specific policies.
We assumed that each of the super regions could achieve the same percentage reduction in sectoral emissions as the region it was mapped onto. For example, if the renewable portfolio standard of 40% resulted in power sector emission reductions of 30% in 2050 in the U.S. EPS, then it was assumed each region that was mapped to the U.S. power sector could achieve a 30% reduction in that region’s power sector emissions through 2050. A similar approach was applied for cross-sector policies.
We then summed the emission reductions across regions by policy type through 2050 to develop cumulative emission reduction estimates through 2050.
In aggregate, we found that a small set of policies, set stringently, could achieve large enough cumulative reductions through 2050 to meet the reductions achieved under the RefPol-500 scenario.
An important note to this analysis is that our method looks at the ability of new policies or strengthened existing policies to drive further emission reductions. The analysis does not attribute the emission reductions from existing policies to the policy category being assessed. For example, China, Poland, and the U.S. all have strong vehicle fuel economy standards on the books. Our modeling evaluates the potential for additional emission reductions on top of those that will be achieved with existing policy. Contextualizing the results within the existing policy framework is critical. Policies that have already been enacted stringently are likely to show smaller emission reductions potential than some might expect, because this analysis looks only at the incremental reductions possible.
| Policy Group | Policy Name | Implementation | Policy Setting in 2030
(Grows at 1%/year after) |
|||
| China | Indonesia | Poland | United States | |||
| Building Codes and Appliance Standards | Appliance Standards Efficiency Improvement | % Improvement in new equipment efficiency | 35% | 35% | 35% | 35% |
| Building Code Efficiency Improvement: Cooling | % Improvement in new equipment efficiency | 35% | 35% | 35% | 35% | |
| Building Code Efficiency Improvement: Envelope | % Improvement in new equipment efficiency | 30% | 30% | 30% | 30% | |
| Building Code Efficiency Improvement: Heating | % Improvement in new equipment efficiency | 30% | 30% | 30% | 30% | |
| Building Code Efficiency Improvement: Lighting | % Improvement in new equipment efficiency | 35% | 35% | 35% | 35% | |
| Building Code Efficiency Improvement: Other Components | % Improvement in new equipment efficiency | 10% | 10% | 10% | 10% | |
| Building Component Electrification | Share of newly sold equipment | 50% | 50% | 50% | 50% | |
| Building Contractor Education and Training | % of potential energy use reduced | 100% | 100% | 100% | 100% | |
| Building Retrofitting | % additional stock retrofitted per year | 2% | 2% | 2% | 2% | |
| Improve Appliance Labeling | % of potential energy use reduced | 100% | 100% | 100% | 100% | |
| Rebates for Efficient Equipment | % of potential energy use reduced | 100% | 100% | 100% | 100% | |
| Carbon Pricing | Carbon Pricing | $/metric ton CO2e | $60 | $60 | $60 | $60 |
| Complementary Power Sector Policies | Additional Demand Response | % of additional potential | 50% | 50% | 50% | 50% |
| Ban New Coal Power Plants | n/a | Yes | ||||
| Early Retirement of Coal Power Plants | Gigawatts per year | 2.5 | 1 | |||
| Least Cost Electricity Dispatch | n/a | Yes | Part of BAU | Part of BAU | Part of BAU | |
| Transmission Growth | % of existing transmission capacity added | 75% | 75% | 75% | 75% | |
| Feebate | Feebate | % of global best practice fee | 75% | 75% | 75% | 75% |
| Fuel Economy Standards | Fuel Economy Standards for HDVs | % additional improvement in new vehicle efficiency | 82% | 82% | 82% | 82% |
| Fuel Economy Standards for LDVs | % additional improvement in new vehicle efficiency | 15% | 160% | 18% | 75% | |
| Fuel Economy Standards for Motorbikes | % additional improvement in new vehicle efficiency | 40% | 40% | 40% | 40% | |
| Industry Energy Efficiency | Cogeneration and Waste Heat Recovery | % of potential emissions reductions | 75% | 75% | 75% | 75% |
| Conversion of Non-CHP Heat to CHP | % of potential emissions reductions | 75% | 75% | 75% | 75% | |
| Early Retirement of Industrial Plants | % of potential emissions reductions | 75% | 75% | 75% | 75% | |
| Improved Industry Worker Training | % of potential emissions reductions | 75% | 75% | 75% | 75% | |
| Industrial Energy Efficiency Standards | % reduction in energy use | 15% | 15% | 15% | 15% | |
| Industrial Fuel Switching from Coal to Natural Gas | % of industry coal use switched | 25% | 25% | 25% | 25% | |
| Industrial Fuel Switching from Natural Gas to Electricity | % of industry natural gas use switched | 25% | 25% | 25% | 25% | |
| Industry Process Emissions Policies | Cement Clinker Substitution | % of potential emissions reductions | 75% | 75% | 75% | 75% |
| Cropland Management | % of potential emissions reductions | 75% | 75% | 75% | 75% | |
| Livestock Measures | % of potential emissions reductions | 75% | 75% | 75% | 75% | |
| Methane Capture | % of potential emissions reductions | 75% | 75% | 75% | 75% | |
| Methane Destruction | % of potential emissions reductions | 75% | 75% | 75% | 75% | |
| Reduced F-Gases | % of potential emissions reductions | 90% | 90% | 90% | 90% | |
| Rice Cultivation Measures | % of potential emissions reductions | 75% | 75% | 75% | 75% | |
| Renewable Portfolio Standard | Distributed Solar Carve Out | Share of building electricity | 15% | 15% | 15% | 15% |
| Renewable Portfolio Standard | % of electricity generation | 50% | 50% | 50% | 50% | |
| Urban Mobility | Transportation Demand Management | % of potential mode shifting | 75% | 75% | 75% | 75% |
| Vehicle Electrification | Electrification of Motorbikes | % of new vehicle sales | 50% | 50% | 50% | 50% |
| Electrification of Passenger HDVs | % of new vehicle sales | 50% | 50% | 50% | 50% | |
| Electrification of Passenger LDVs | % of new vehicle sales | 50% | 50% | 50% | 50% | |