Public Health and Additional Outputs
In addition to the totaled quantities available on the Cross-Sector Totals sheet and the Cost Outputs sheet, the Energy Policy Simulator (EPS) calculates numerous other outputs that are useful for understanding the full range of impacts of the modeled policy package. A variety of these outputs are available on this sheet.
Public Health
The EPS calculates emissions reductions of 12 different pollutants, several of which have direct, negative impacts on human health, such as nitrogen oxides (NOX), sulfur oxides (SOX), and directly-emitted particulate matter (PM). Most of the same policies that reduce greenhouse gas emissions also reduce emissions of these other pollutants (carbon capture and sequestration being the most important exception), so most policy packages that aim to mitigate climate change also have direct human health benefits.
Typically, to calculate the change in health outcomes due to a change in emissions, two intervening calculation steps are necessary:
-
Changes in pollutant emissions are entered into a gridded air quality model, such as GEOS-Chem or CMAQ, to determine the change in ground-level concentration of various pollutants throughout the modeled year.
-
Changes in ground-level concentration are fed into epidemiological concentration-response functions (CRFs), which relate the change in concentration to the change in a rate of a negative health outcome, such as premature mortality. Multiplying by the business-as-usual rate of that negative health outcome gives the change caused by the policy package.
Though CRFs can be computed quickly, gridded air quality models are slow to run, so they cannot be directly integrated into a computer model that provides real-time interactivity and feedback, such as the EPS. Fortunately, some organizations that use gridded air quality models, such as the U.S. Environmental Protection Agency, have computed and published "reduced-form tools" that enable one to calculate the public health benefits of emissions reductions without running a gridded air quality model oneself. These tools can produce results that are "reasonably comparable to those derived from full-form models" and are the best available option for computing public health benefits in the EPS.
The EPS calculates the change in the following public health outcomes caused by the policy package:
- Premature mortality (i.e. deaths, both infant and child/adult)
- Asthma symptoms (albuterol use, chest tightness, cough, shortness of breath, and wheeze)
- Asthma incidence (new cases)
- Hay fever (allergic rhinitis) incidence
- Respiratory emergency room visits
- Respiratory hospital admissions
- Nonfatal heart attacks
- Minor restricted activity days
- Lost workdays
- Lung cancer incidence
- Cardiovascular hospital admissions
- Alzheimer's disease hospital admissions
- Parkinson's disease hospital admissions
- Stroke incidence
- Out-of-hospital cardiac arrest incidence
- Cardiac emergency room visits
- School loss days
In the web interface, these are grouped into eight summary categories; the list above reflects the more detailed set of outcomes tracked in Vensim.
Particulates are the primary cause of these negative health outcomes, including primary particulates (those directly emitted by combustion) and secondary particulates (those formed in the atmosphere by chemical reactions involving gaseous pollutants). The health outomes simulated in the EPS are only due to particulates, not other pollutants (such as ozone), so the public health impacts estimates produced by the EPS may be conservative.
Model Structure
The total emissions of each pollutant in the BAU and policy cases are obtained from the Cross-Sector Totals sheet, and we take the difference to find the change in pollutant emissions caused by the policy package. (For the small number of EPS models configured to include emissions associated with imported electricity in the in-region emissions total, we exclude these emissions from the public health calculations, as we are only tracking health incidents caused by in-region emissions.) We then multiply the change in emissions of each pollutant by a set of Health Outcome Incidence per Ton Pollutant multipliers, from the reduded-form tools discussed above. Outcomes are quantized (rounded down) in increments set by the input data variable 'Quantization Size for Health Outcomes.'
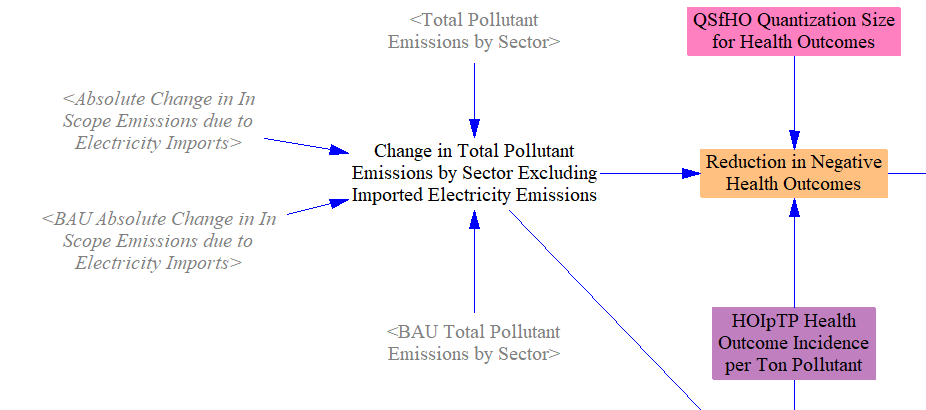
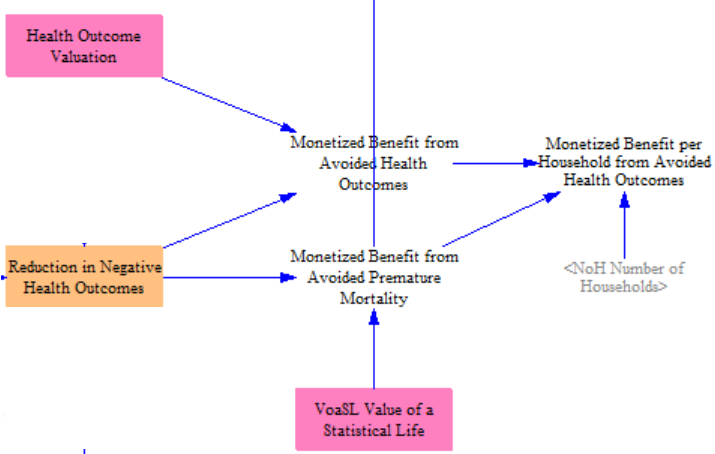
In some cases, it is useful to be able to see public health benefits in currency units - e.g. for comparison with other costs or savings. The EPS monetizes avoided premature mortality using a Value of a Statistical Life (VSL) figure, taken in as input data. The other, non-fatal health outcomes are monetized using a separate set of per-incident dollar values (Health Outcome Valuation), also taken in as input data; these are multiplied by the avoided incidents of each outcome and summed. (The per-incident value table assigns zero to the mortality outcomes, which are valued through the VSL path instead, avoiding double-counting.) Premature mortality typically represents the large majority of the total monetized benefit, because of the high value assigned to avoided deaths relative to the per-incident values for non-fatal outcomes. The model also reports the total monetized health benefit on a per-household basis.
Additionally, the EPS provides an estimated demographic breakdown of premature mortality incidents, where input data are available. We take in input data from FoHObDT Fraction of Health Outcomes by Demographic Trait and multiply by the number of avoided premature deaths to allocate them to specific demographic traits. For the U.S. model, the relevant traits are sex, race, and Hispanic or Latino status. The main complexity of this process occurs not within Vensium but within the Excel file for variable FoHObDT Fraction of Health Outcomes by Demographic Trait (which draws from results from air quality and public health models). The sources and methods are carefully documented and explained within that file - simply download the model and review the file for more details.
The demographic breakdown is further split into infant premature mortality and child-and-adult premature mortality. Infant mortality is calculated using a separate FoIPMbDT Fraction of Infant Premature Mortality by Demographic Trait lookup that maps total avoided infant deaths to specific demographic traits, and child-and-adult mortality is similarly mapped via FoCaAPMbDT. This split lets users compare relative outcomes for infants versus the broader child-and-adult population within each demographic group.
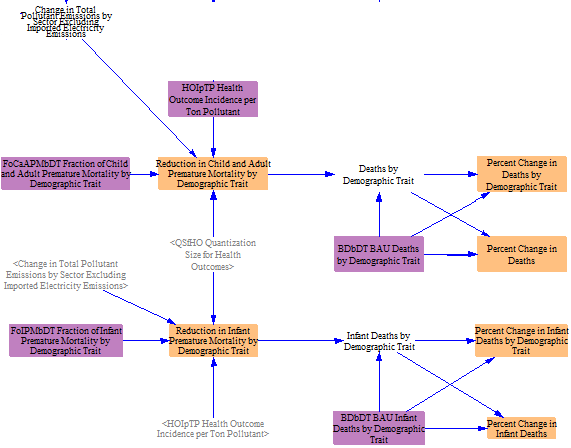
So that we can display demographic mortality results as percentage changes (which is helpful for making comparisons between demographic groups), we calculate the number of deaths by demographic trait (in the policy case) by subtracting avoided deaths from BAU deaths, and we compare policy case deaths to BAU deaths by demographic trait to find percent changes. Both child-and-adult and infant premature mortality percent changes are calculated.
Avoided Climate Damages
The model also estimates monetized social benefits from avoided climate damages. We take the difference in CO2e emissions between the BAU and policy cases, and we multiply it by the Social Cost of Carbon, a projection of the value to society in avoiding a given quantity of CO2e emissions. The structure is shown below:

Total Monetized Social Benefit
Finally, we sum the changes in monetized public health impacts (from particulates) and monetized climate damages to obtain a total social benefits from emissions reduction, when represented in economic terms (rather than negative outcomes avoided). We also calculate the social benefit per unit emissions abatement caused by the policy package. The structure is shown below:

Energy-Related Emissions
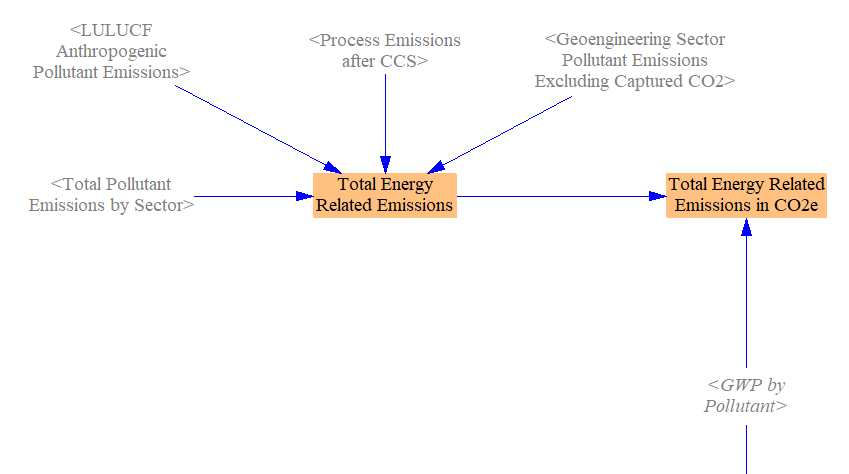
Some users might want to know the amount of emissions from the production of energy (in any form, such as heat, electricity, light, or force). All emissions in the Energy Policy Simulator (EPS) are "energy-related" except industrial sector process emissions and anthropogenic LULUCF emissions. We include the effects of carbon sequestration conducted by the electricity and industry sectors, which effectively reduces these sectors' net CO2 emissions, so the total energy-related emissions reported here do not include CO2 sequestered by these sectors. In contrast, for the geoengineering sector, we do not subtract captured CO2 (i.e., from direct air capture; DAC) from total energy-related emissions. (We only include emissions from energy used to power geoengineering processes.) In the geoengineering sector, the CO2 removal is the product/purpose and these negative emissions are not considered energy-related.
We calculate energy-related emissions for both the BAU and policy cases. From "Total Pollutant Emissions," we subtract anthropogenic LULUCF emissions and Industry sector process emissions. For geoengineering, we take the total emissions excluding captured CO2. We then convert this to CO2e using the user-specified GWP factor. A screenshot of the structure for the policy case is shown below:
Miscellaneous Additional Outputs
This section contains a variety of outputs that may be of use for scenario analysis. These outputs need little calculation structure (or in some cases, they are simply shadow variables from elsewhere), so they do not merit their own sections on the "Additional Outputs" sheet.
Electricity capacity divided up by type (coal, wind, etc.) but not by plant quality level is provided here. Similarly, we provide electricity generation (i.e. output) by type but grouped across quality levels:

We total up the amount of primary energy from non-fossil sources, and we also express this as a percentage of total primary energy:

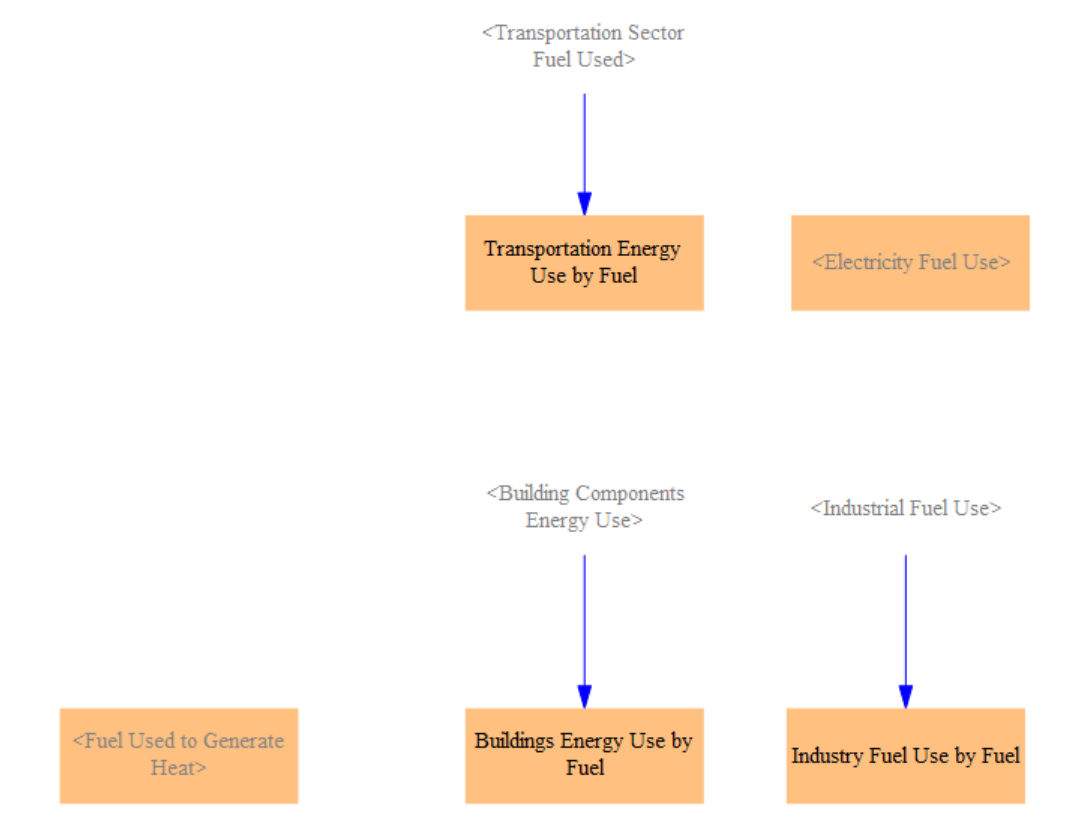
We also report the fuel use for each fuel-using sector (transportation, electricity, buildings, industry, and district heat) by fuel:
We also calculate the change in net electricity imports, which is used in one output graph.

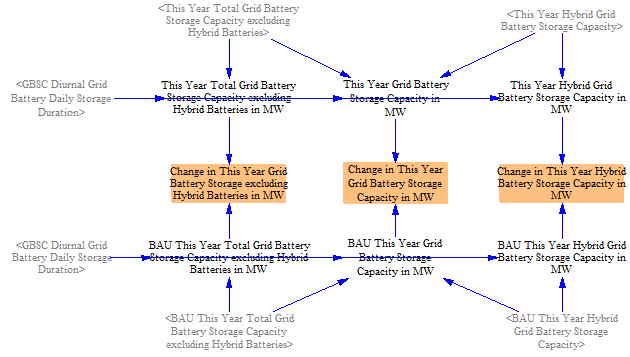
Finally, we calculate the change in battery storage capacity relative to the BAU, which is used in one output graph. Battery storage tracking is split between standalone grid batteries (excluding hybrid) and hybrid grid battery storage, with both quantities reported in MW and MWh.
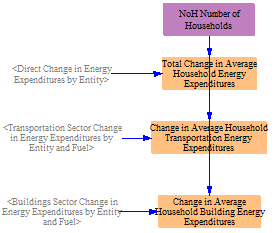
Lastly, we calculate per-household energy-expenditure outputs in this section, including the change in average household building energy expenditures and the change in average household transportation energy expenditures. These are computed by dividing the relevant entity-level change in energy expenditures (e.g., the consumer share) by the number of households (read in as input data), giving a per-household figure that is useful for comparing policy effects on average household energy bills.
This page was last updated in version 4.0.5.