Carbon Capture and Sequestration
General Notes
The carbon capture and sequestration (CCS) sheet handles various calculations relating to the quantity of CO2 sequestered, the amount of fuel burned to power this sequestration, the cost of the capital equipment needed to sequester this amount of carbon, and the O&M and other costs for this equipment. All of these results are disaggregated between the electricity sector (where they are divided between four types of CCS-equipped power plants including coal, lignite, natural gas combined cycle, and biomass plants) the industry sector (where they are divided up by industry), and the hydrogen sector (where CCS can be used to create blue hydrogen). These results are then used on the sheets for the electricity, industry, and hydrogen sectors in the model. Final emissions and cash flow calculations are not conducted on the CCS sheet; its purpose is to do supporting calculations for the other sectors. Italics, which are used in the model (in all sheets) to denote when a variable is going to or coming from a different sector of the model, are useful for seeing which results on the CCS sheet are used on other sheets.
Quantity of CO2 Sequestered
We start by calculating the amount of CO2 sequestered by sector. The approach varies by sector.
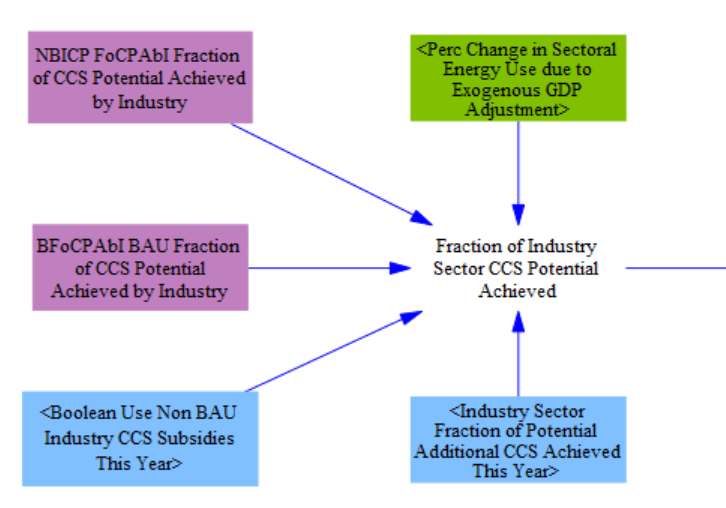
We do not have endogenously determined CCS in the industry sector, so the fration of the total CCS potential that is achieved by each industry category is read in as input data. We take in a BAU fraction of potential (subscripted by sector) as input data, and a user-set policy lever specifies a fraction of the additional (i.e. remaining) potential that is achieved in the policy case. We also include one other policy lever that allows users to use an alternate pre-determined data set of CCS fractions associated with a non-BAU CCS tax credit amount, if desired. In the event of an exogenous GDP adjustment (that is, to simulate a recession that is not reflected in the BAU input data), we adjust downward the achievement of CCS potential in the BAU case and increase the remaining potential accordingly, as a recession likely reduces achievement of CCS in the absence of CCS-promoting policy.
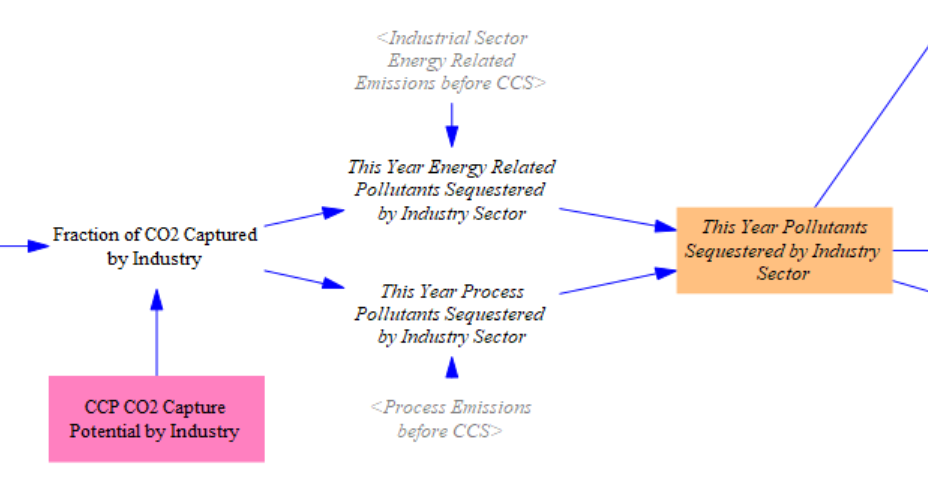
Next, we convert the fraction of industry CCS potential to a fraction of industry CO2 captured. Both energy-related and process emissions within each industry category (e.g. cement, iron and steel, etc.) has its CO2 capture potential specified individually in input data. For example, one industry might have the potential to capture 90% of its process CO2 emissions, while another industry might have the potential to capture 95% of both its process and energy-related CO2 emissions. Multiplying these potentials by the fraction of potential achieved gives the fraction of CO2 captured.

We multiply the fraction of CO2 captured by the amount of CO2 emissions from each industry.
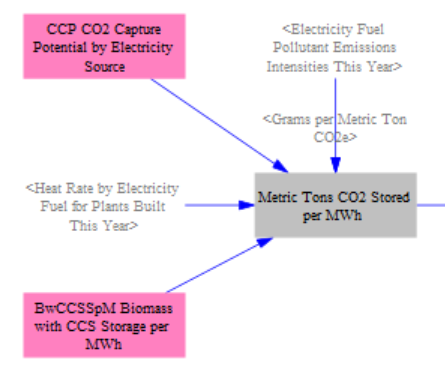
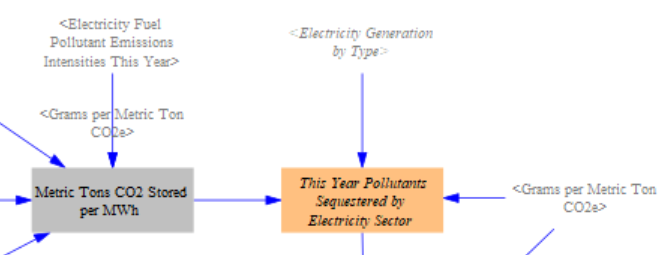
Next, we calculate the amount of CO2 sequestered by the electricity sector. We first find the metric tons CO2 stored per MWh of electricity generation (subscripted by plant type). This can be calculated using emissions intensities, heat rates, and the capture potential of each CCS-equipped power plant type (i.e., the fraction of total emissions that are captured via CCS). There is a special input data file to specify the amount of CO2 stored per MWh of biomass with CCS generation, since biomass plants are often considered zero-emissions technologies for emissions accounting purposes, which can lead to negative emissions for this plant type.
The electricity sector calculations have already determined the amount of electricity generation by each CCS-equipped power plant type. This is multiplied by the CO2 stored per MWh to find the total amount of CO2 stored by the electricity sector.
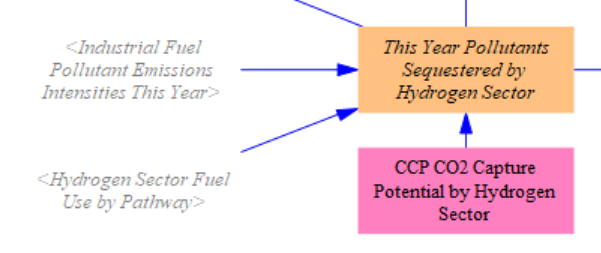
Finally, the hydrogen sector has similarly already calculated the BTUs of fuel consumed to produce blue hydrogen. Multiplying this by each fuel's pollutant emissions intensity equals the pre-CCS CO2 emissions from blue hydrogen production, which is then multiplied by input data on the average CCS capture potential in the hydrogen sector to find the total CO2 captured.
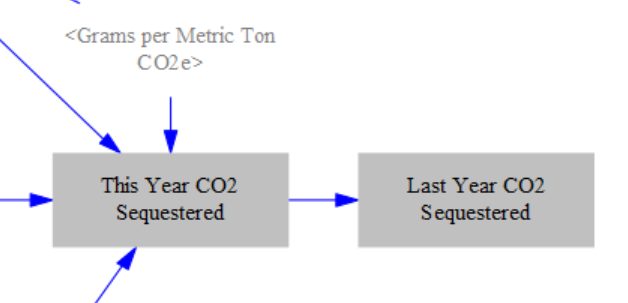
We sum up the total amount of CO2 sequestered across all sectors for use in the endogenous learning calculations.
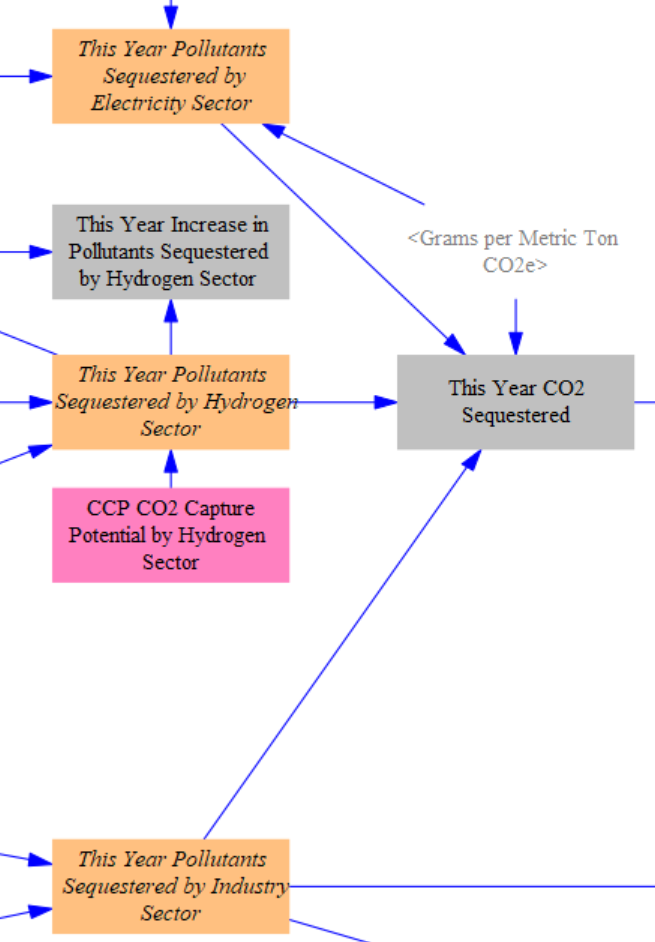
We introduce a one-timestep delay in the sequestration quantities, which will be used to calculate the fuel use for the CCS process (and associated CCS costs), to avoid circularity.
Capital Costs of CCS Equipment
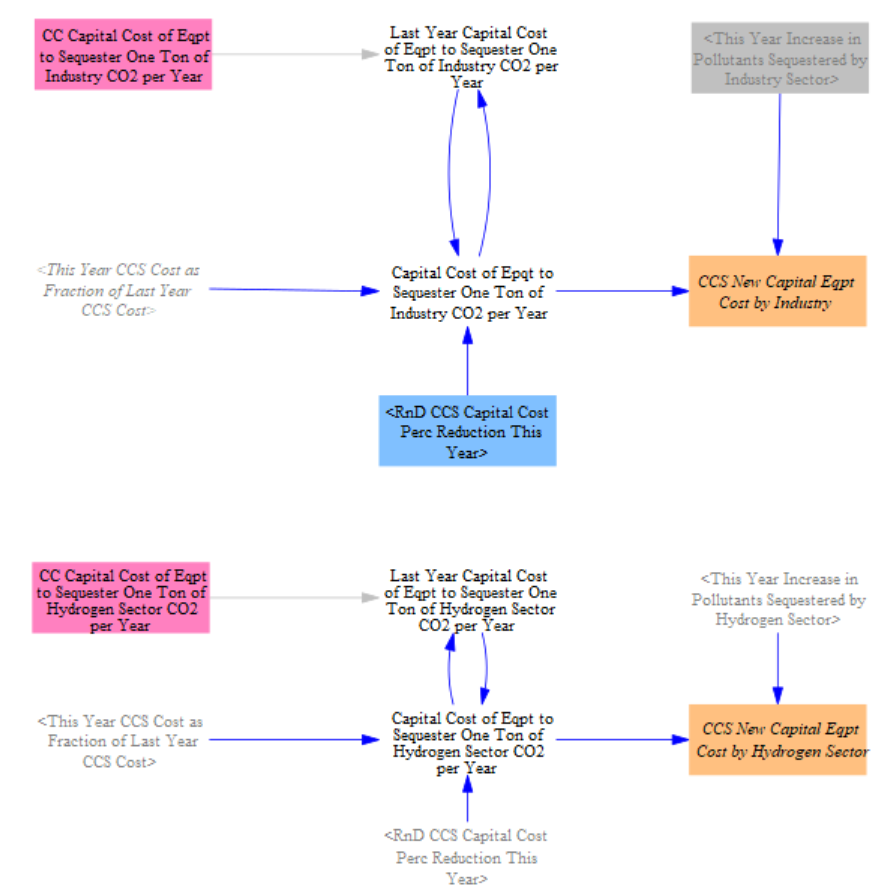
The cost of new CCS capital equipment is based on an endogenous learning curve, so that it is cheaper the more CCS equipment has been deployed. We use a percentage decline per doubling of capacity to determine the cost of CCS equipment in the current model year relative to the last year. That is multiplied by the cost of CCS equipment in the last year to find the current year cost. The CCS module only calculates the capital equipment costs for the industry and hydrogen sectors, because the capital costs for CCS-equipped power plants are already covered in the electricity sector cash flows. The user-specified R&D policy that reduces CCS equipment cost is also applied at this stage.
Unlike O&M costs, capital equipment costs are only paid on newly-purchased CCS equipment, not on equipment that was installed in a prior model year. Therefore, we use the year-over-year increase in quantity of CO2 captured.
This increase is calculated separately for each power plant type and each industry, to allow for the possibility that use of CCS is growing for certain plant types or industries, even as CCS usage remains flat or even decreases for other plant types or industries.
The main way by which CCS usage can decline is if the user specifies an increase followed by a reduction in CCS use in their policy settings. However, in most situations, there will not be CCS equipment retirements during a model run, because the lifetime of CCS equipment is long (25-40 years) and any preexisting CCS equipment is relatively new, so retirements during the course of the model run are not significant.
O&M Costs of CCS Equipment
Next, we calculate the O&M costs of CCS. As with the capital cost calculations, we do not calculate electricity sector O&M costs for CCS here since those are already covered in power plant O&M costs.
We represent the amount of CCS equipment in terms of its sequestration capacity: that is, the amount of equipment necessary to sequester a particular mass of CO2 per year.
O&M must be paid on all operating CCS equipment. Therefore, we take the total amount of sequestration occurring in the modeled year and multiply by the O&M cost per ton of CO2 sequestered to obtain the total amount of O&M costs incurred in the modeled year.
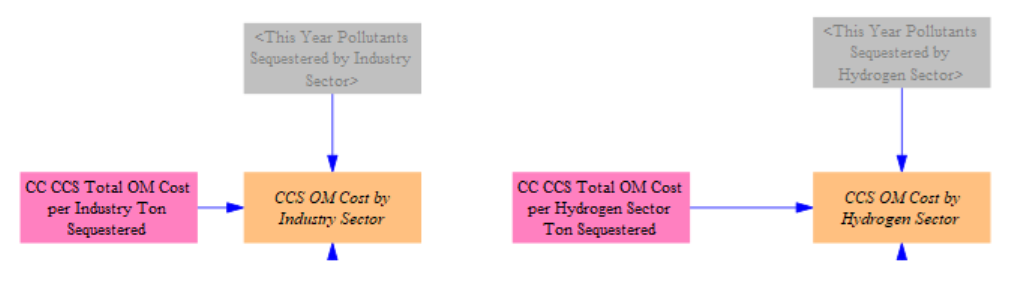
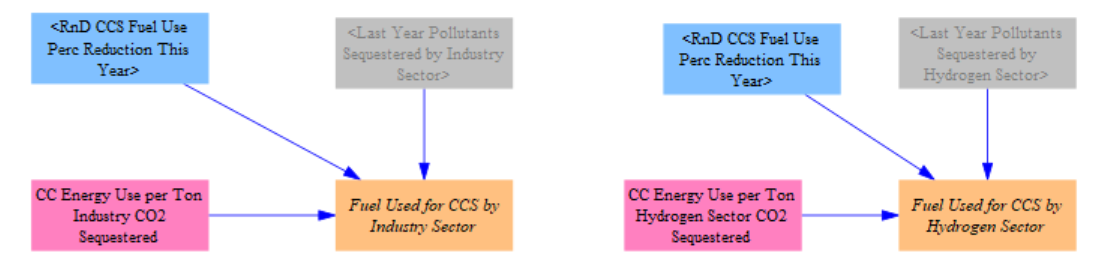
Fuel Used to Power the Sequestration Process
We then determine how much of which types of fuels are consumed to power the sequestration process (again, for just industry and hydrogen). First, we take the total amount of CO2 sequestered by each sector and multiply by the amount of energy needed to sequester one ton of CO2, which is read in from input data files. The fuel use is also adjusted by the user-selected R&D setting for CCS fuel efficiency.
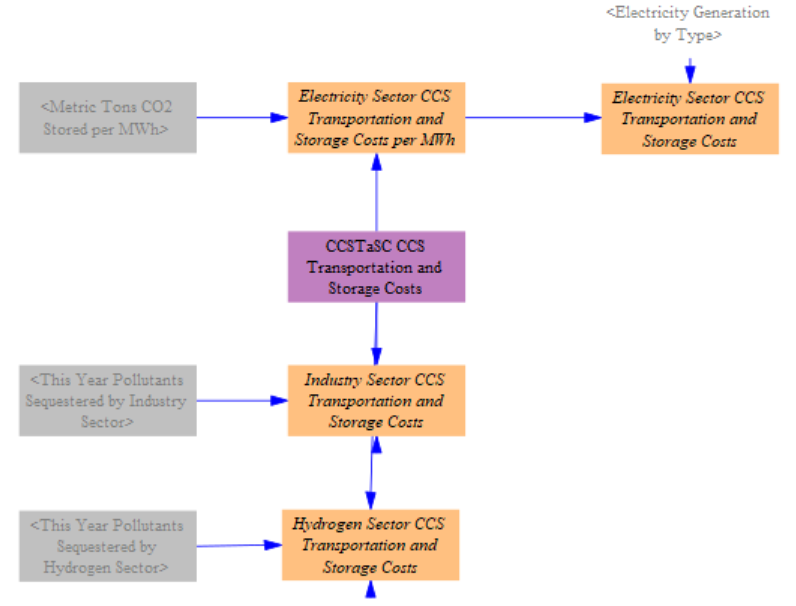
Transportation and Storage Costs
Facilities operating CCS also need to pay transportation and storage costs, which are not typically considered part of capital or O&M costs. These costs accrue per unit of CO2 captured, and we assume these costs do nto vary by sector. For the industry and hydrogen sectors, we simply multiply the transportation and storage cost by the amount of CO2 captured captured that year. For the electricity sector, we have an additional step to calculate the transportation and storage cost per MWh of electricity produced, which is used in the electricity sector to help calculate the levelized cost of new power plants.
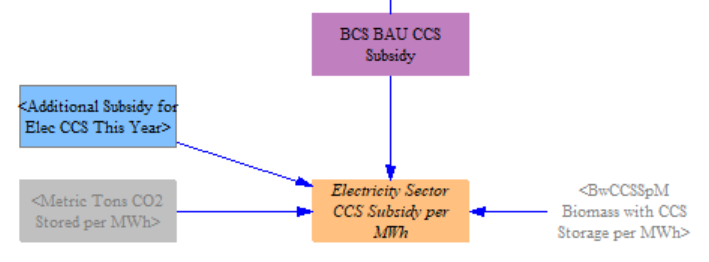
CCS Subsidies
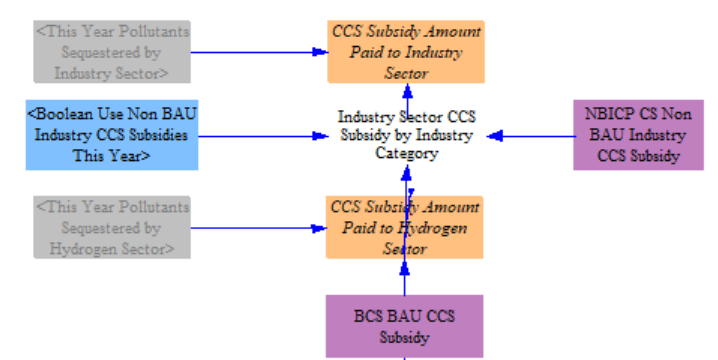
The final step in the CCS module is to track the change in subsidies paid for CCS. For each sector, we need the total CCS subsidies paid for use in the respective sectors' cash flow pages. In addition, the electricity sector needs the CCS subsidies per MWh electricity generated for use in the levelized power plant cost calculations. We take in input data on BAU CCS subsidies by sector in terms of dollars per ton of CO2 sequestered and also allow for additional user-enabled CCS subsidy settings subscripted by power plant type. The BAU and user-enabled subsidies are summed and multiplied by the total CO2 captured by power plant type to find the total subsidies. Like above, we need special handling for biomass power plants due to the fact CO2 from biomass plants can be considered zero-emissions.
We also allow for additional user-enabled CCS subsidies in the industry sector, which can be subscripted by industry category. Any user-enabled change in subsidies is summed with the BAU industry CCS subsidy and multiplied by CO2 sequestered by each industry to find the total subsidies paid in this sector. We do not allow for additional subsidies for the hydrogen sector at this time so simply take the CO2 sequestered by this sector multiplied by the BAU subsidy.
This page was last updated in version 4.0.4.